

Zefeng Wood Industry: Our main products include melamine-faced medium-density fiberboard, melamine-faced particleboard, melamine plywood, plywood, construction laminated board, WPC wallboard, PVC edging strips, and stone-plastic UV board
- Tel:+86-15610632233
- Email:ceo@wbphuanghe.net

12
2025
-
09
China's artificial board imports and exports hit a record high in 2024.
As a global leader in the production and export of man-made boards, China saw its import and export trade grow in 2024 despite challenges in both domestic and international markets.
China's artificial board imports and exports hit a record high in 2024.
2025-09-10 Source: China's Man-Made Boards
As a global leader in the production and export of man-made boards, China saw its import and export trade grow in 2024 despite challenges in both domestic and international markets. Throughout the year, total imports of man-made boards reached 1.0794 million tons, marking a new high in nearly 10 years, while exports surged to 10.0551 million tons, also hitting an all-time record. Among these figures, Plywood Imports totaled 261,100 tons, representing a substantial year-on-year increase of 33.76%—the highest level in nearly 10 years—while exports reached 6.7681 million tons, up 18.95% from the previous year and also hitting a new 10-year peak. Particleboard Imports totaled 764,800 tons, a slight year-on-year increase of 1.03%, while exports reached 528,600 tons, marking a robust year-on-year growth of 34.40%. Fiberboard Imports totaled 53,500 tonnes, marking a rebound after declining, though they remain at a low level. Meanwhile, exports reached 2.7584 million tonnes, hitting a nearly 10-year peak. In terms of target markets, import sources are becoming more concentrated, while exports are shifting toward emerging markets.
1 Current Status of China's Man-Made Board Import and Export Trade
1.1 Import Trade
China is a key global player in the production and export of man-made boards. According to customs import and export data, China’s imports of man-made boards showed an overall upward trend from 2014 to 2024, reaching nearly 1.0794 million tons in 2024—the highest level in the past decade (see Figure 1).
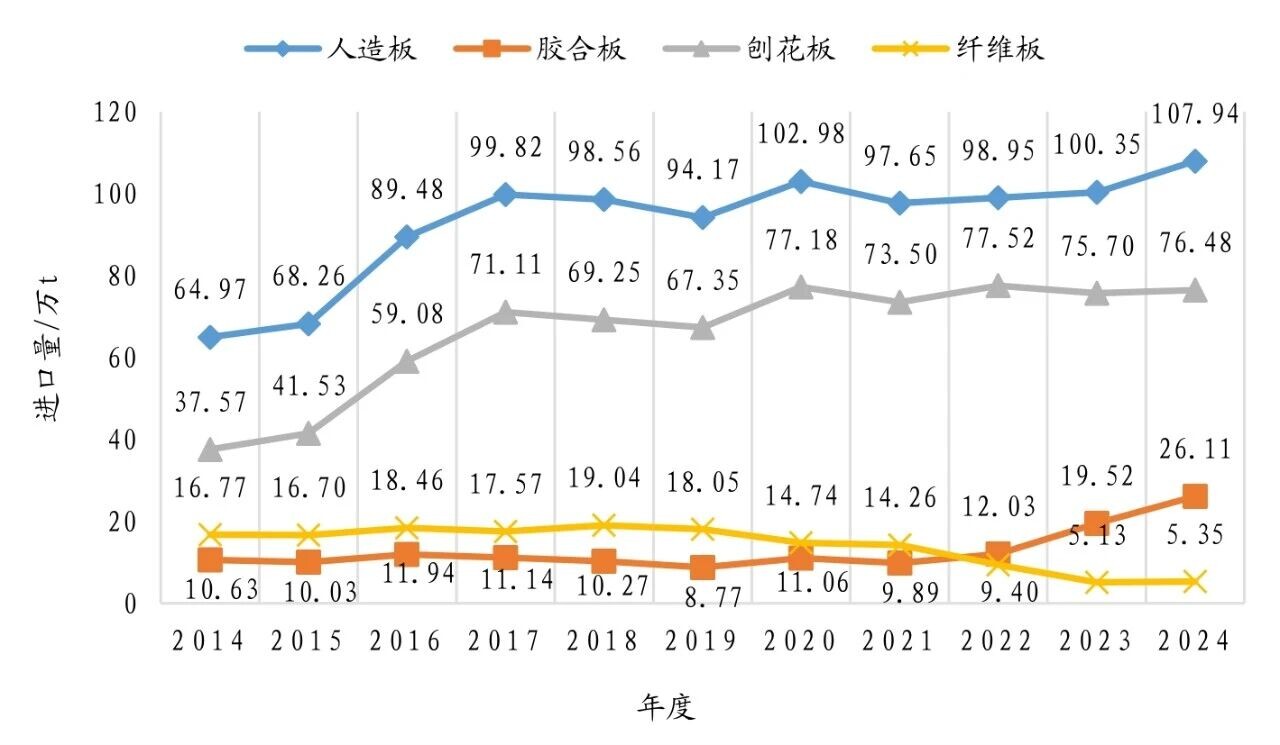
Figure 1: China's Imported Man-Made Board Volume, 2014–2024
From 2014 to 2024, China’s plywood import volume experienced significant fluctuations, heavily influenced by changes in both domestic and international market conditions as well as global political dynamics. Starting from 2022, imports once again began to rise steadily, reaching 195,200 tons in 2023—a growth rate of 62.26%. In 2024, driven by the Russia-Ukraine conflict, a large influx of low-priced Russian plywood entered the Chinese market, causing China’s plywood imports to surge dramatically to 261,100 tons, representing a remarkable 33.76% increase and marking the highest level in nearly 10 years.
Particleboard remains the only type of engineered wood panel in China where imports exceed exports. The country’s imported particleboard is primarily used in the furniture manufacturing industry. From 375,700 tons in 2014, the import volume surged to 764,800 tons in 2024, showing an overall trend of fluctuating growth. While particleboard imports have generally been on the rise, the pace of growth has slowed considerably in recent years, with year-on-year increases of -2.34% in 2023 and 1.03% in 2024. From 2014 to 2017, particleboard imports experienced rapid growth, driven by Chinese furniture exporters seeking to meet the stringent U.S. mandatory standards for formaldehyde emissions in panel furniture, thereby boosting demand for high-quality particleboard and spurring increased imports. However, from 2017 to 2024, as China’s domestic particleboard production capacity continued to expand, the growth rate of imports gradually moderated, stabilizing between 670,000 and 780,000 tons annually. Looking ahead, with the ongoing expansion of advanced particleboard production lines across China, the nation’s reliance on imported particleboard is expected to decline significantly in the future.
Over the past decade, China’s imports of fiberboard have shown a fluctuating downward trend. Taking 2018 as a turning point, imports rose steadily from 2014 to 2018 but then began declining again from 2018 to 2024. Notably, from 2021 to 2023, China’s fiberboard imports plummeted sharply—from 142,600 tons in 2021 to just 51,300 tons in 2023. Fortunately, import volumes stabilized and even rebounded slightly in 2024, though they remain at historically low levels. This trend can be largely attributed to the robust progress made by China’s fiberboard industry, driven by supply-side structural reforms. Thanks to significant advancements in production technology and capacity expansion, the industry has greatly enhanced its ability to meet domestic demand, thereby reducing reliance on imported fiberboard and lowering overall import needs.
As shown in Figure 1, the trend of engineered wood panel imports closely mirrors that of particleboard imports, with particleboard accounting for 57% to 79% of total engineered wood panel imports (see Figure 2). Meanwhile, plywood imports have remained steady at 9% to 25% of the overall engineered wood panel import volume, reaching a nearly 10-year high of 24.19% in 2024. In contrast, fiberboard imports have steadily declined over the years, dropping from 25.82% in 2014 to just 4.96% in 2024.
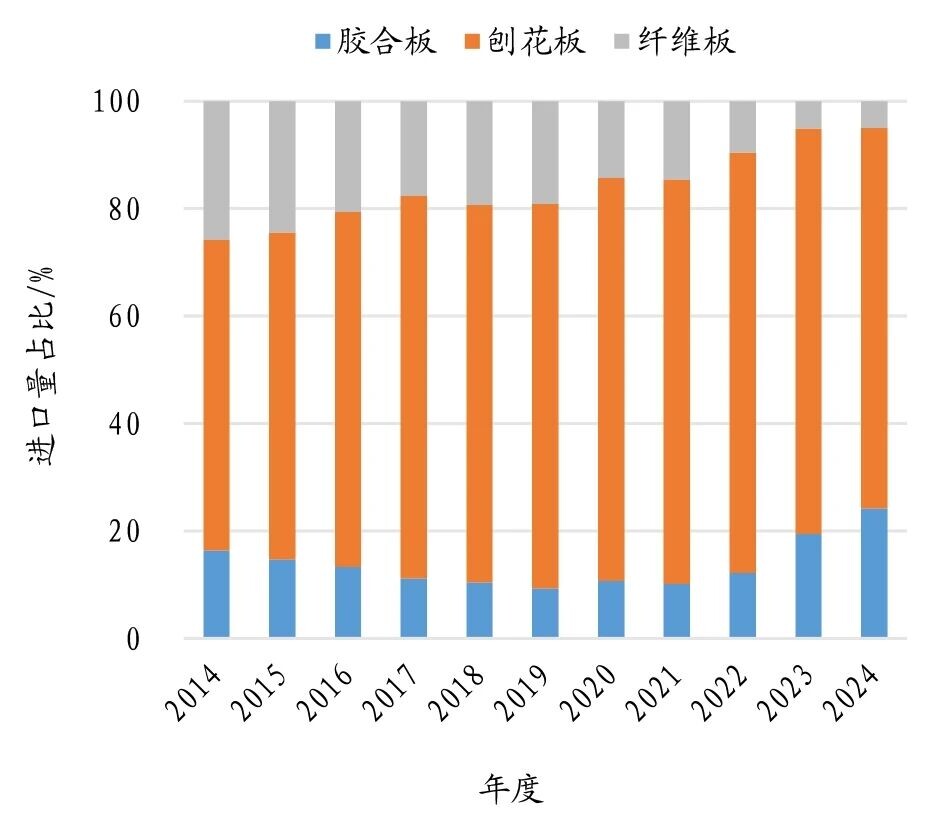
Figure 2: Proportion of China's Imports of Plywood, Particleboard, and Fiberboard in Total Imports of Man-Made Boards (2014–2024)
1.2 Export Trade
From 2014 to 2024, China's exports of man-made boards experienced overall fluctuating changes. From 2014 to 2020, export volumes showed a downward trend with periodic fluctuations, reaching a low of 6.9343 million tons in 2020. However, in 2021, exports rebounded sharply, increasing by 33.77% year-on-year. In 2022, export volumes saw a slight year-on-year decline, but from 2022 to 2024, man-made board exports rose steadily each year, peaking at a new high of 10.0551 million tons in 2024 (see Figure 3).
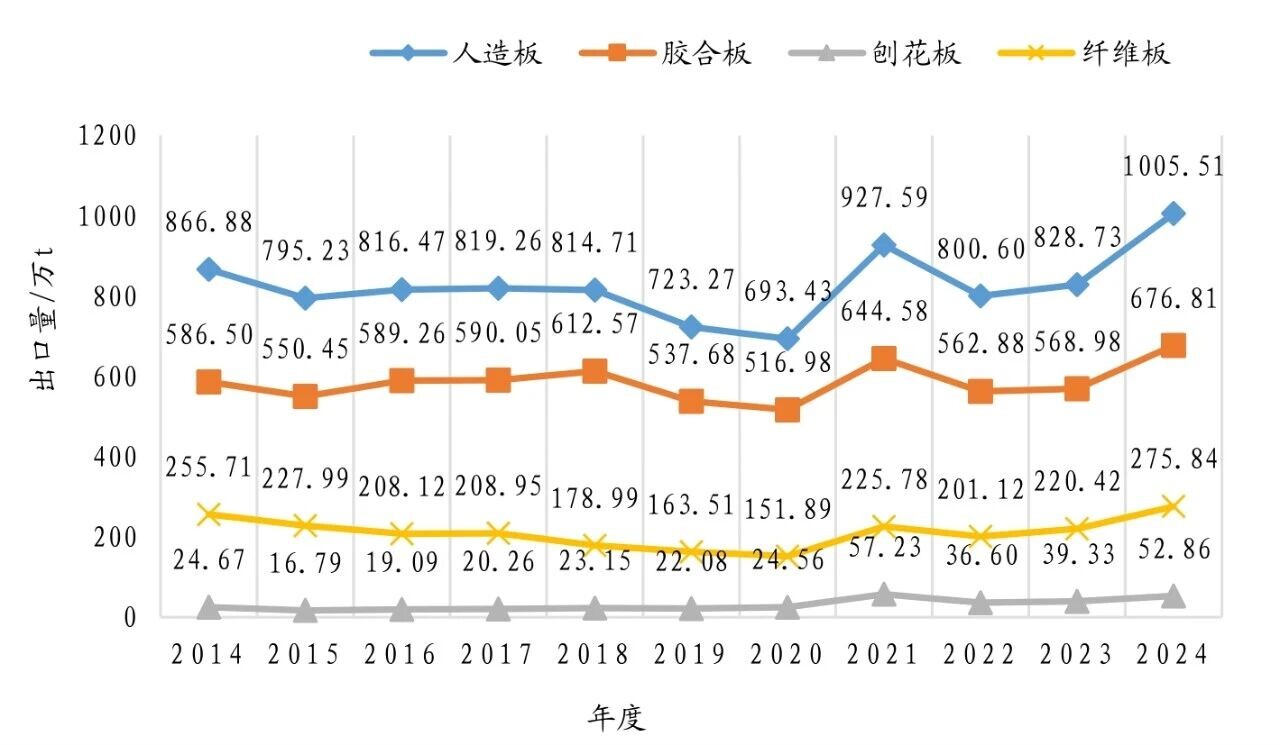
Figure 3: China's Artificial Board Export Volume, 2014–2024
Plywood continues to maintain its position as the largest category of China's engineered wood product exports. From 2014 to 2023, plywood exports fluctuated between 5.15 million tons and 6.45 million tons. Thanks to the global economic recovery and the growth of emerging markets, China's plywood exports surged to 6.7681 million tons in 2024, representing a year-on-year increase of 18.95%—the highest export volume in nearly a decade.
In 2024, China's particleboard exports experienced a significant surge, reaching a total of 528,600 tons for the year—up 34.40% from 2023, nearly matching the historic high achieved in 2021. This impressive growth was primarily driven by the global economic recovery, which boosted demand in the construction and furniture industries. Additionally, continuous advancements in China's particleboard production technologies have led to improved product quality and stricter environmental standards, enhancing the country's competitiveness in the international market. Meanwhile, some traditional particleboard-producing nations have faced supply shortages due to supply chain disruptions or rising costs, creating valuable market opportunities for Chinese exporters. Overall, the combination of increasing demand, technological upgrades, supportive policies, and favorable market conditions has collectively fueled the remarkable expansion of China's particleboard exports in 2024.
Over the past decade, China’s fiberboard export volume first declined and then rebounded. In 2014, exports reached 2.5571 million tons, but gradually fell in the following years, dropping to a nearly 10-year low of 1.5189 million tons in 2020. However, by 2021, exports saw a significant recovery, climbing back to 2.2578 million tons—a growth rate of 48.65%. From 2022 to 2024, fiberboard exports continued their upward trajectory, rising from 2.0112 million tons to 2.7584 million tons, marking a new peak in nearly a decade. In recent years, thanks to advancements in domestic fiberboard production technology and capacity expansion, China’s fiberboard products have become increasingly competitive in the global market, driving the sustained growth in export volumes.
As shown in Figure 3, the trend of engineered wood panel exports closely mirrors that of plywood exports. From 2014 to 2024, plywood exports remained relatively stable, ranging between 5.16 million and 6.77 million tons, accounting for 65% to 76% of China's total engineered wood panel exports. Meanwhile, fiberboard accounted for approximately 21% to 30% of the total (see Figure 4).
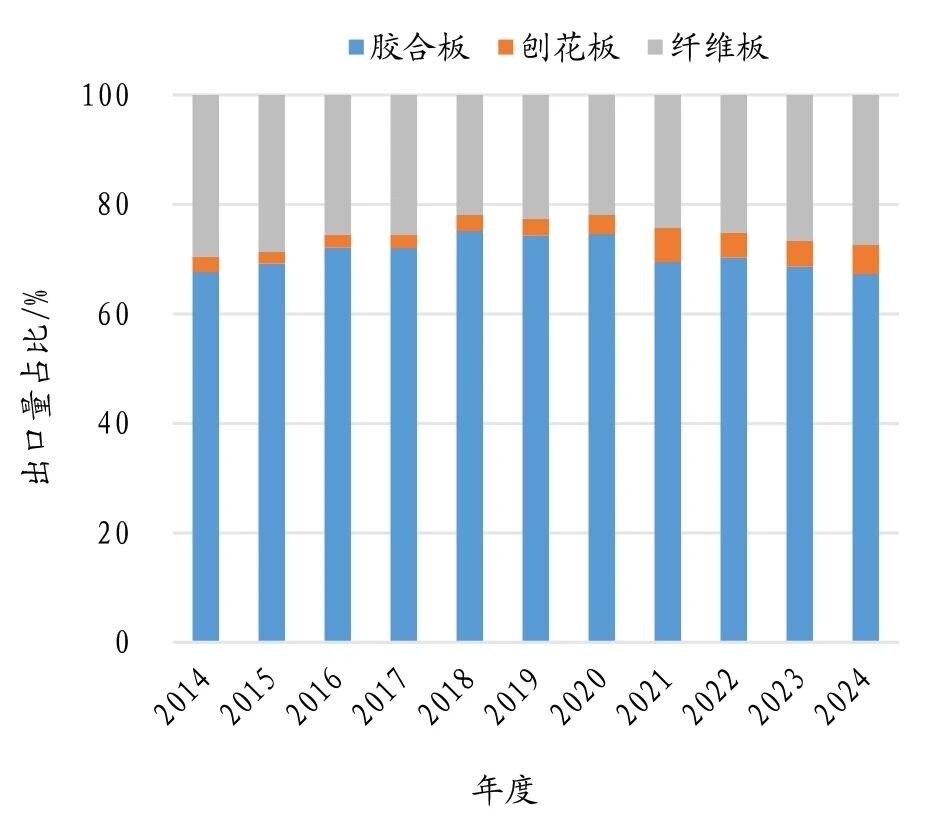
Figure 4: Proportion of China's Imports of Plywood, Particleboard, and Fiberboard in the Total Exports of Man-Made Boards (2014–2024)
2 Analysis of Target Markets for China's Man-Made Board Import and Export Trade
In recent years, the target markets for China's man-made board import and export trade have changed significantly due to factors such as geopolitical conflicts, slow global economic recovery, changes in domestic and international demand, and domestic capacity and technological upgrades.
2.1 Analysis of Target Markets for Import Trade
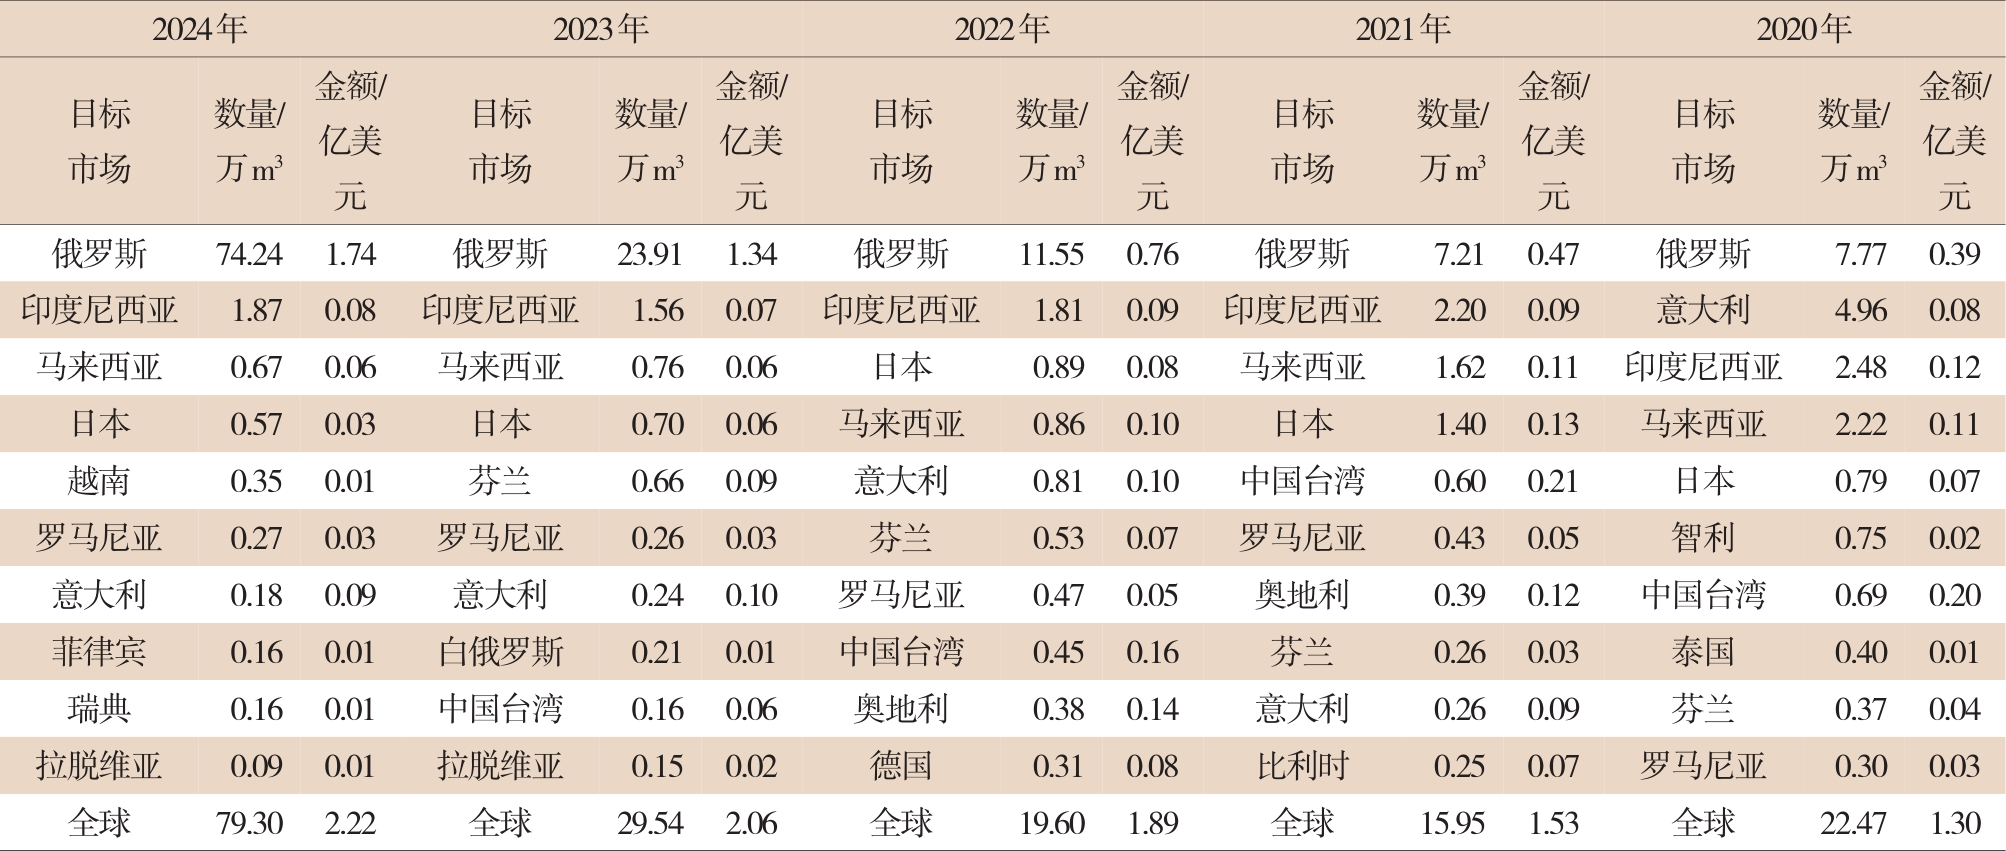
From 2020 to 2024, the main source countries/regions for China's plywood imports are concentrated in Russia, Indonesia, Malaysia, Japan, the European Union, and others (see Table 1). Russia has been the largest source country for China's plywood imports in the past five years. In 2020, the quantity of plywood imported from Russia accounted for 34.58% of China's total plywood imports, rising to 93.62% in 2024. This is because since the Russia-Ukraine conflict, the European and American markets have sanctioned Russian timber, and Russia has adjusted its timber export policy (banning raw log exports and encouraging processed product exports). Therefore, China has become an important destination for Russian plywood exports, especially in 2024 when the quantity of plywood imported from Russia increased by 210.50% year-on-year, while the average unit price decreased by 58.18%. However, the value of plywood imports from Russia as a proportion of total plywood import value rose from 30% in 2020 to 78.38% in 2024. Regarding import unit prices, among the top 10 countries by import volume in 2024, the average unit price of plywood imported from Italy was the highest at $5,000/m³; Malaysia, Romania, and Latvia followed at around $1,000/m³; Indonesia, Japan, the Philippines, and Sweden ranged between $400–650/m³; Russia and Vietnam were concentrated between $200–300/m³, showing significant price differences.
Table 1 Top 10 Countries/Regions by China's Plywood Import Volume from 2020 to 2024
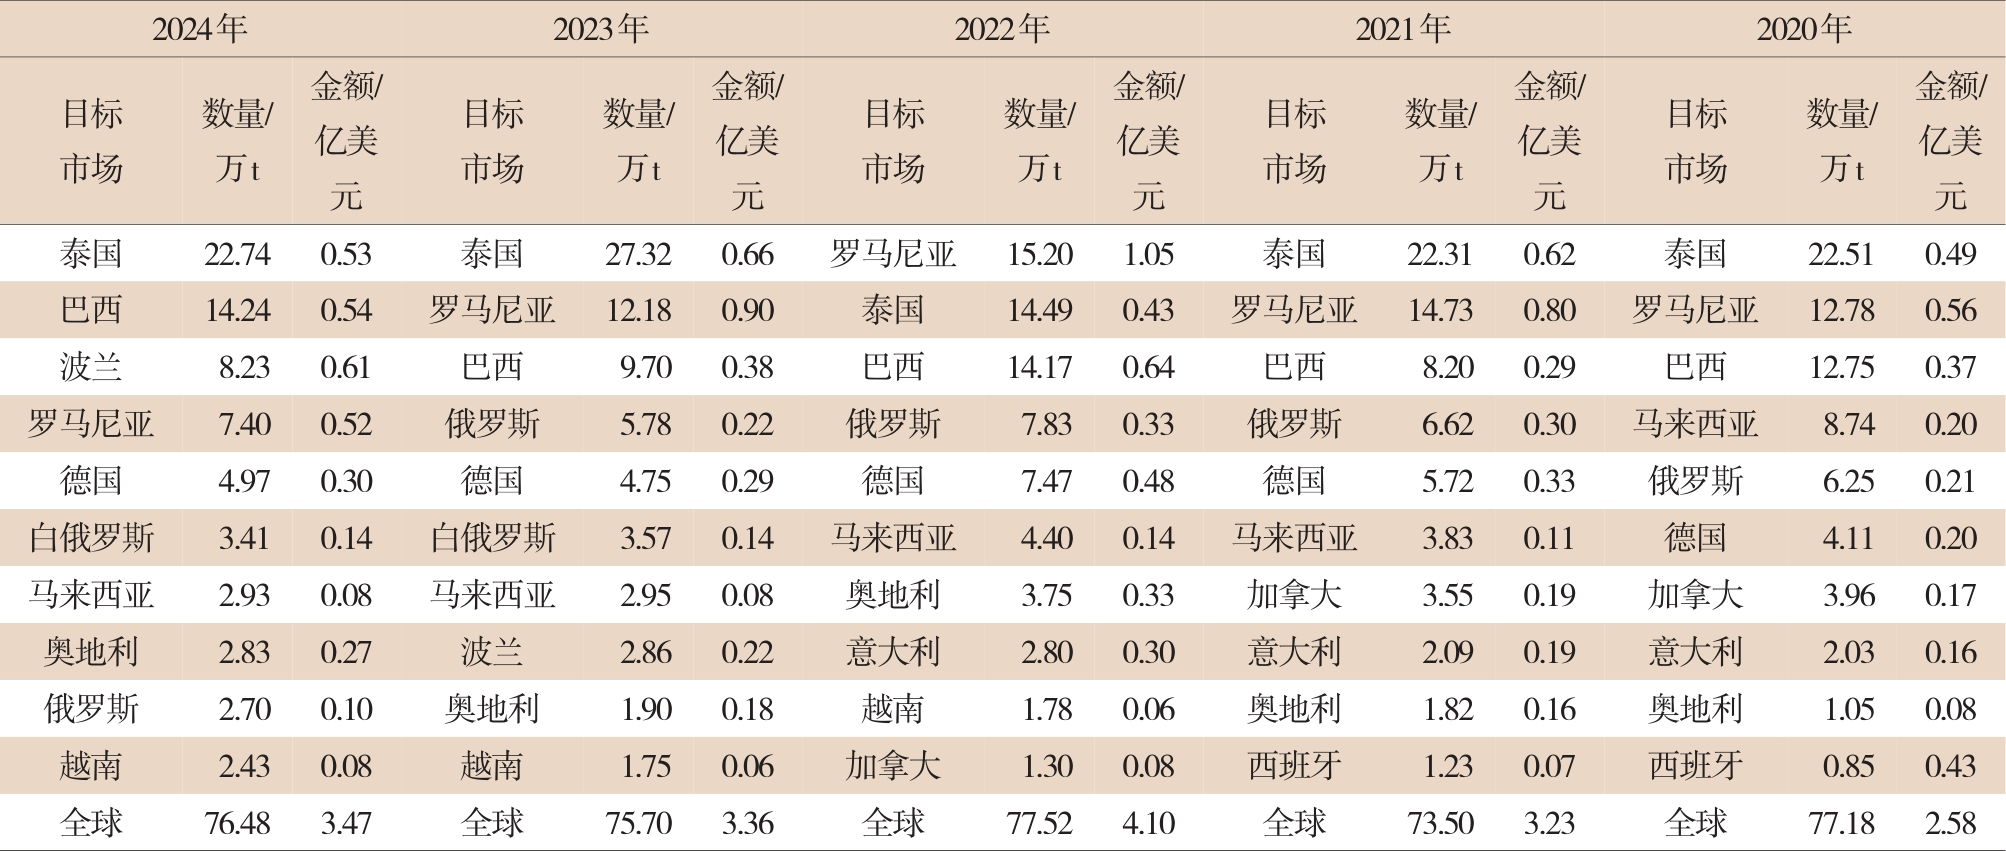
In the past five years, China's main sources for particleboard imports have been concentrated in Thailand, Brazil, Romania, Germany, Belarus, Malaysia, and other countries (see Table 2). Although Thailand remained the largest source country for China's particleboard imports in 2024, the import volume decreased by 16.76% year-on-year, and the import value decreased by 19.7%. Besides Thailand, among the top 10 countries by import volume, two countries saw significant declines: Romania and Russia. In 2024, particleboard imports from Romania decreased by 39.24% in volume and 42.22% in value year-on-year; imports from Russia decreased by 53.29% in volume and 44.44% in value. In contrast, particleboard imports from Poland surged by 187.76% in volume and 177.27% in value in 2024. This is mainly due to the normalized operation of the China-Europe Railway Express, which reduced logistics costs and time, enhancing the cost-performance advantage of Polish particleboard in the Chinese market. Additionally, imports from Brazil and Vietnam also increased by over 40% year-on-year, driven by strengthened economic and trade cooperation between China and these countries in recent years. Under the global supply chain adjustment background, China's strategy of diversifying import sources is also a reason for the increased imports from Poland, Brazil, and Vietnam.
Table 2 Top 10 Countries/Regions by China's Particleboard Import Volume from 2020 to 2024
From 2020 to 2025, the top 10 markets for China's fiberboard imports remained relatively stable, mainly concentrated in the European Union, Thailand, New Zealand, and other countries (see Table 3). Among them, in 2024, the quantity of fiberboard imported from Romania increased by 118.18% year-on-year; imports from New Zealand, Thailand, Belgium, Australia, and the Netherlands also increased year-on-year; imports from Germany, Spain, and Poland decreased by more than 25% year-on-year. Regarding import value, although imports from New Zealand and Thailand increased in volume, their import values did not show significant growth; the import values from Romania and Belgium both doubled year-on-year, but their import volume growth differed greatly, with Belgium's fiberboard unit price being higher. Over the past five years, the quantity of fiberboard imported from Romania has gradually increased, rising from 13th place in 2020 to 4th place in 2024. It is foreseeable that fiberboard trade between China and Romania will become closer in the future.
Table 3 Top 10 Countries/Regions by China's Fiberboard Import Volume from 2020 to 2024
2.2 Analysis of Target Markets for Export Trade
From 2020 to 2024, the top 10 target markets for China's plywood exports have changed (see Table 4). The Philippines and the United Kingdom have consistently ranked first and second in export volume. The quantity of plywood exported to the United States and Israel has significantly declined, dropping out of the top 10 from 5th and 10th place in 2020 to below the top 10 in 2024. Meanwhile, China's plywood exports to Saudi Arabia and the United Arab Emirates have continuously increased. The UAE's export volume rose from 503,500 m³ in 2022 to 743,200 m³ in 2024; Saudi Arabia's rose from 435,500 m³ in 2022 to 618,600 m³ in 2024. This shows that China's efforts to develop emerging markets for plywood have begun to bear fruit. In terms of value, China's total plywood export value in 2024 was $5.271 billion, a year-on-year increase of 9.42%. Among the top 10 target markets for plywood exports in 2024, markets with significant growth include the UAE, Taiwan (China), Saudi Arabia, Vietnam, and Australia.
Table 4 Top 10 Countries/Regions by China's Plywood Export Volume from 2020 to 2024
In the past five years, China's main particleboard export destinations have been developing countries, especially emerging markets in Southeast Asia, the Middle East, and South America (see Table 5). Mongolia has been the second largest market for China's particleboard for three consecutive years. In 2024, China's particleboard exports to Peru increased by 102.04% year-on-year; meanwhile, exports to the United States, the United Kingdom, Japan, and South Korea have decreased. For example, the UK's ranking dropped from 6th in 2021 to 24th in 2024. In terms of export value, the top five countries/regions by particleboard export volume in 2024 all saw year-on-year growth in export value: Taiwan (China) increased by 34.38%, Mongolia by 90.91%, Nigeria by 8.33%, Chile by 50.00%, and Vietnam by 20.00%.
Table 5 Top 10 Countries/Regions by China's Particleboard Export Volume from 2020 to 2024
From 2020 to 2024, the top 10 countries/regions for China's fiberboard export volume (see Table 6) showed that except for a slight year-on-year decline in exports to Algeria, exports to the other nine countries increased year-on-year. Although Mexico dropped from 2nd place in 2023 to 3rd in 2024, its export volume increased by 7.41% year-on-year; exports of fiberboard to Vietnam, Saudi Arabia, Mexico, Nigeria, the United States, the UAE, and Canada increased by 109.62%, 81.55%, 7.41%, 4.96%, 13.83%, 53.89%, and 24.54% respectively. It can be seen that fiberboard exports to the North American market have remained stable in the top 10 over the past five years, and fiberboard is the only type of man-made board from China that has been stably exported to the North American market in recent years, indicating that China's fiberboard still has a competitive advantage in developed country markets. In terms of export value, the United States was China's largest fiberboard export market in 2024, with export value increasing by 15.17% year-on-year. It is worth noting that although Nigeria's export volume increased year-on-year, its export value decreased by 14.77%, due to the overall decline in fiberboard prices in the international market combined with fluctuations in Nigeria's local currency exchange rate.
Table 6: Top 10 Countries/Regions in China's Fiberboard Export Volume from 2020 to 2024

3 Key Countries' Policy Changes in Artificial Board Trade
Since 2020, countries around the world have been reshaping competition rules, adjusting artificial board trade policies, and redefining the global landscape of artificial board trade through environmental regulations, technical standards, and regional agreements.
Developed countries have shown a clear inclination toward trade protectionism in an effort to safeguard their domestic industries, continuously launching anti-dumping and countervailing duty investigations into imported Chinese-made wood panels. This trend has heightened risks in international trade transactions, delivering a significant negative impact on China’s foreign trade development of wood panels. For instance, on November 6, 2020, South Korea, under Ministry of Economy and Finance Decree No. 814, decided to maintain its anti-dumping duties on Chinese softwood plywood, imposing tariffs ranging from 5.33% to 7.15%. The measure was initially set to remain in effect for three years. Then, on July 3, 2023, South Korea’s Ministry of Economy and Finance initiated a second sunset review investigation into the anti-dumping duties on Chinese softwood plywood. South Korea’s “double anti” investigations have undermined the competitiveness of China’s plywood exports to South Korea, placing additional burdens on Chinese exporting companies. Meanwhile, the United States, as a major consumer of wood panels, has been conducting anti-dumping and countervailing duty investigations into imports of Chinese hardwood plywood since 2016. On December 1, 2022, the U.S. Department of Commerce launched a **second sunset review investigation** into anti-dumping and countervailing duties on Chinese hardwood plywood. Furthermore, on June 8, 2023, the U.S. International Trade Commission (ITC) began examining imports of Chinese hardwood plywood. Solid Wood Composite Flooring The U.S. made a final affirmative ruling in the second sunset review of anti-dumping and countervailing duties, determining that the current anti-dumping and countervailing measures will remain in effect. In April 2025, the White House announced the imposition of a "baseline tariff" of 10% on all countries, while simultaneously introducing higher "reciprocal tariffs" for nations and regions—including China—that maintain significant trade deficits. This move has further strained the U.S.-China trade environment, disrupting global industrial and supply chains. Meanwhile, EU member states have erected trade barriers through stringent environmental regulations, demanding that imported wood-based panels comply with sustainable forest management and eco-friendly standards to meet market access requirements. In 2019, the European Green Deal was unveiled, strengthening enforcement of the EU Timber Regulation. Building on this, the EU introduced the EU Deforestation-Free Products Act in 2023, mandating that imported wood-based panels come with full-chain traceability certificates proving their timber origins. These EU initiatives have increased costs for Chinese exporters, compelling businesses to undergo transformative changes—investing more heavily in environmental protection and upgrading product standards—to satisfy the stringent export-market准入 criteria.
Overall, over the past five years, countries' policies on man-made board trade have placed varying degrees of emphasis on protecting domestic industries and promoting sustainable development. While these policies have created trade opportunities, they have also sparked friction and challenges, driving the ongoing evolution of the global man-made board trade landscape. As a result, businesses must closely monitor policy developments and remain agile in adjusting their strategies to navigate this complex and ever-changing trade environment.
4 Future Trends in China's Imports and Exports of Man-Made Boards
China's engineered wood industry has effectively tackled multiple challenges in both domestic and international markets, achieving steady growth in import and export trade in 2024. Despite the continued recovery and improvement of key economic indicators in 2024, the overall trend of "increased volume but declining prices" persists, with domestic demand for engineered wood remaining relatively low. Meanwhile, ongoing geopolitical instability and the growing trend of "decoupling and supply chain fragmentation" have dealt a setback to China's exports of engineered wood to traditional developed markets. As a result, tapping into emerging markets has become a new growth driver for China's engineered wood trade. Overall, against the backdrop of global industrial chain integration and development, China's engineered wood import and export trade continues to be brimming with opportunities. Looking ahead, under the policy framework of "seeking progress while maintaining stability—and using progress to bolster stability"—the industry must seize the chance to boost domestic demand while simultaneously exploring promising international emerging markets. Addressing these challenges will be critical for breaking through the bottlenecks hindering the sustainable growth of China's engineered wood sector.
First, broaden the supply chain and strengthen the integration of industrial chains. Against the backdrop of global industrial chain integration and development, China's engineered wood panel industry can enhance market concentration by leveraging large enterprises, foster greater synergy between upstream and downstream sectors, and deepen the overall integration of the industry chain. From the perspective of diversifying upstream raw material supplies, the industry can tap into overseas ports built by China—such as Gwadar Port and Chancay Port—to expand international logistics networks, actively seek out new trade partners, and widen access to global raw material sources. This will ensure a stable supply of timber while reinforcing collaborative ties with downstream industries like furniture and construction.
Second, it’s about enhancing product added value and creating new demand. Faced with sluggish domestic market demand and the trend of "increased volume but declining prices," as well as the growing emphasis on sustainable development and the "Dual Carbon" strategy, China's engineered wood panel industry is shifting from focusing on "volume growth" to prioritizing "quality enhancement." On one hand, panel manufacturers can boost product quality and increase added value by innovating processing technologies and product designs—such as developing eco-friendly, zero-formaldehyde boards that meet consumers' environmental concerns for indoor air quality. They can also explore innovative product designs tailored to modern lifestyles, expanding the application areas of engineered wood panels and stimulating fresh market demand. On the other hand, companies can elevate their competitive edge by improving service offerings, differentiating their products through personalized customization, meticulous management of installation processes, and robust after-sales support. By building strong brand identities and achieving premium pricing through superior quality and renowned brands, the industry can drive high-quality, sustainable growth in China’s engineered wood panel sector.
Third, we must stabilize and expand into emerging markets while deepening regional cooperation. China's trade in man-made boards has gradually shifted its focus from developed countries to emerging markets. On one hand, to meet the growing demand for sustainable products in developed regions such as Europe and North America, manufacturers can enhance internal controls or pursue certifications to satisfy the entry requirements of these markets. Meanwhile, industry associations can play a coordinating role, helping Chinese man-made board companies collaborate more effectively, pool their strengths, and collectively boost their influence in the international market. On the other hand, leveraging the Belt and Road Initiative, companies should strengthen economic partnerships with countries along the route, actively seek out new trading partners, and tap into promising emerging markets like ASEAN, the Middle East, and Africa to establish a strong foothold locally.
Disclaimer: All content marked with a source indication is either a repost or officially registered and published by corporate users. Our website reprints these materials solely for the purpose of sharing more information. If the reposted articles or images raise copyright concerns, please contact us directly for removal. Additionally, regarding user comments and other such submissions, our website does not necessarily endorse their views or verify the accuracy of their content.
Contact Us
Office Address: 10th Floor, Taihe Huayu, Zhengyang Road, Shouguang City, Shandong Province
Factory Address: No. 10 Changjiang Road, Daotian Town Government Resident, Shouguang City, Shandong Province

LEAVE A MESSAGE
Online consultation